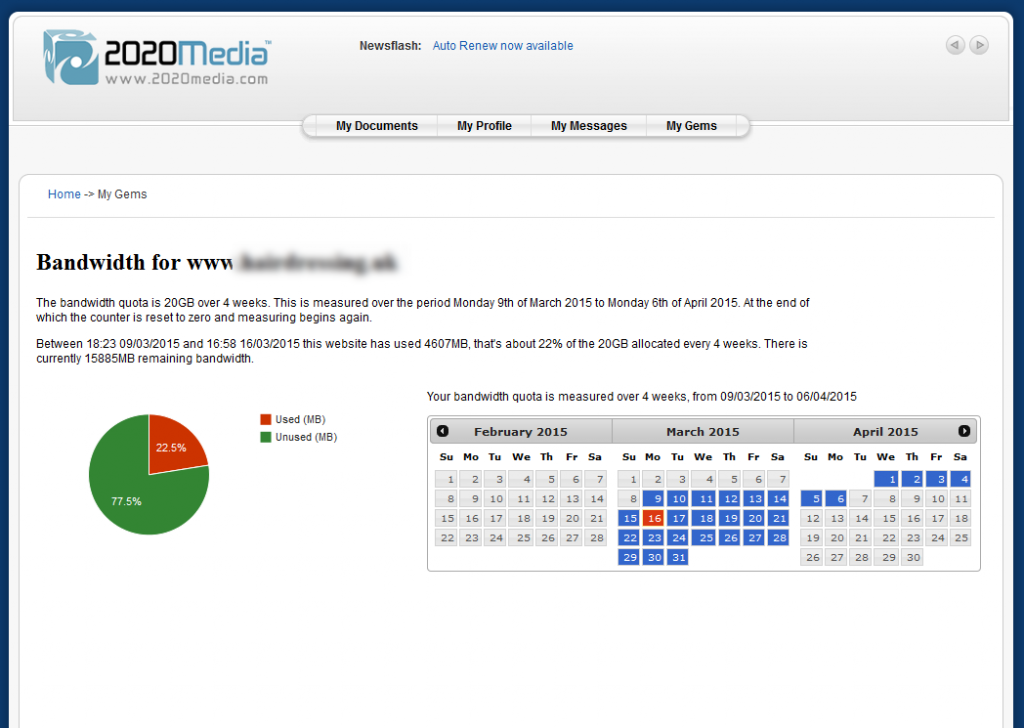
We’ve just released a new control panel ‘gem’ – our name for useful tools the enhance our customer’s service.
The bandwidth reporting gem gives customers a live view of their website’s bandwidth usage.

The rest of this blog post is about how we created the functionality so non-techies can stop reading now!
Looking inside the code
 This functionality was made possible because of mod_cband. mod_cband is an apache module that monitors and controls individual website bandwidth usage. It handily includes an xml output. We set parameters of the website and the server it’s hosted on. The script then loads the xml file from the relevant server and pulls out the data for the chosen site. There are three useful values:
- Quota
- Total used
- Time until refresh
‘Quota’ is the hosting plan bandwidth quota – for example 10GB per month. Mod_cband does not allow calendar month periods, so we use 4 weeks (a hidden bonus on our hosting plans as customer effectively get up to 3 free days of bandwidth a month!). The ‘Time until refresh’ is a countdown to the time when the bandwidth ‘Total used’ is reset back to zero. Note the XML does not include the period over which the bandwidth is measured, but for 99% of sites we use 4 weeks so this is not a problem.
Taking this data, we can then create some pretty graphs to illustrate the website’s usage. We use the Google Chart API – Google chart tools are powerful, simple to use, and free. Try out our rich gallery of interactive charts and data tools. Using javascript librarys you can send some values and get back a lovely bar chart, timeline or as in our case, a pie chart.
 data.addRows([
 ['Used (MB)', <?php echo $used;?>],
 ['Unused (MB)', <?php echo $unused;?>],
 ]);
The resulting graphic includes nice rollovers and is extensively customisable (although of course there are always one thing you want to do that isn’t supported!).
We also wanted to show customers how long their site had left before the quota was reset. In the xml feed, this comes out of mod_cband as “Time to Refresh”:
<time_to_refresh>3W 0D 01:03:17</time_to_refresh>
Not the ideal parameter to work with! However we can do some conversions and math on it, to work out the start date and end date of the period.
$wdhms = convertdate($refresh);  // converts time_to_refresh into seconds
$totaltime = 2419200; // number of seconds in 4 weeks
$today = time();
$timeused = $totaltime - $wdhms;
$startdate = ($today - $timeused);
$enddate= ($today + $wdhms);
Then we use another Google Javascript library to display this in a calendar format. We chose datepicker as it’s well documented and fits in well with the javascript based pie-chart used in the bandwidth representation.
The datepicker setup is very similar to the piechart:
    beforeShowDay: function(date) {
    var date1 = $.datepicker.parseDate($.datepicker._defaults.dateFormat,"<?php echo date('m/d/Y',$startdate);?>");
// Date format MM/DD/YYYY
    var date2 = $.datepicker.parseDate($.datepicker._defaults.dateFormat, "<?php echo date('m/d/Y',$enddate);?>");
    return [true, date1 && ((date.getTime() == date1.getTime()) || (date2 && date >= date1 && date <= date2)) ? "dp-highlight" : ""];
     }
Div tags are used to layout the information as in the screenshot above. These will flow nicely on small screen devices, as we aim to make all our customer-facing websites fully responsive.
Future plans
We aim to add this reporting functionality across other services such as broadband.