Do you like data? We do! This post is about trends and data useful for optimising your website for getting more visitors (traffic) and contains lots of pretty pie charts to help explain what you should do to improve your web profile.
When building a website, there are certain questions you should be asking yourself.
- What is my target audience?
- How are they going to find my website?
- What search engines should I target?
- What browsers should I make sure my website supports?
Target Audience
Are you providing information? Selling something? Providing a service? These are the kind of questions that will help you decided how to build your website. The answers to these are down to you, but will affect the kind of website you build, whether you’ll need the services of third parties (such as PayPal for example), and the kind of hosting you’ll need. As a very experienced host, 2020Media is happy to discuss your likely needs with you, at no cost. Please contact us, if you’d like our help.
How will they come?
How do you think your website visitors will arrive at your website? There are basically 3 ways:
- From the results of a query on a search engine.
- From a link on another website
- Direct – by typing in your website address (domain name) directly to their browser.
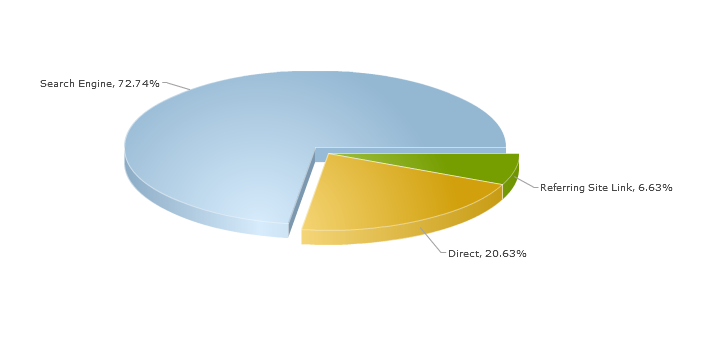
The graph shows that most traffic to websites comes from a search engine. The 20% of direct traffic reflects the importance of a good domain name. Although there is normally not much to be gained in terms of visitors coming from other websites, it is still very important to get good links from relevant websites as these affect how your site will rank in the search engines.
Which Search Engine?
So we’ve established that most traffic to websites comes from search engine results. The most popular search engine by a long way is Google. Google’s share is around 80% at present. Bing (from Microsoft) comes second with 8.7%, Yahoo next with 8.0%. Runners up include Ask (1.4%) and AOL (1.3%).
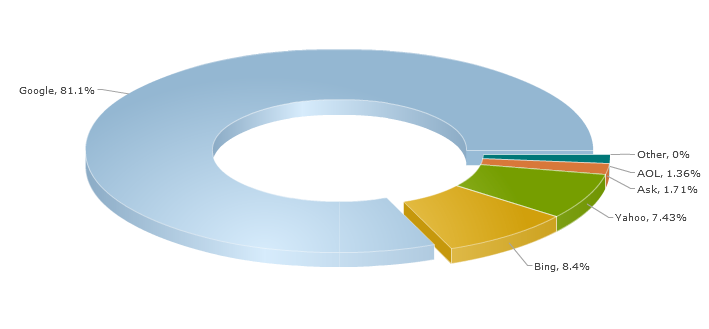
Market Share is important for where you spend your advertising budget, and also how much time you spend getting your site into those search engines.
Position is Important
When you are using a search engine, how often do you need to look at the 2nd or 3rd pages of results? We’re guessing not very often. The alogorithms used by search engines are now incredibly sophisticated, and now include your past searching habits to help tune the results to what they think you want. This means we’re now in the era of personalised search. Now, no two users will see the same set of results for a given search term.
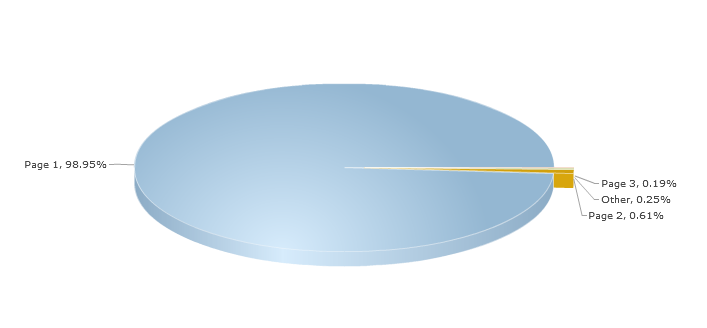
Page 1 is clearly the place to be. Getting a page one placement for common terms is difficult to say the least. If you sold cars, getting your website on the first page of results if someone typed ‘Cars’ into a search engine would be an uphill struggle. However as our next chart shows, most users don’t type single word queries.
Phrases are Key
The report below summarizes the number of keywords used by end-users when using search engines. For example, “used car sales” has three keywords while “used car sales milton keynes” has five keywords.
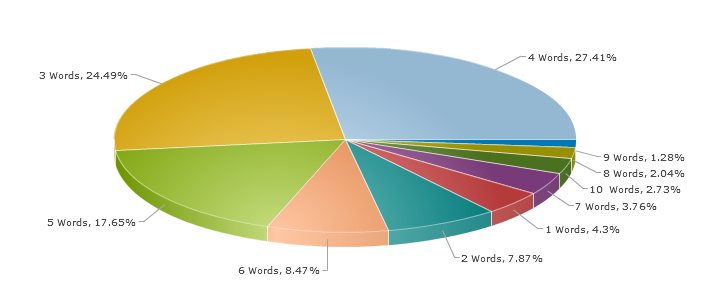
This analysis reveals that the majority of searches conducted on popular search engines such as Google, Yahoo, Bing etc. contain 3 or more keywords. Over time, users of the internet have adapted their behaviour to be more specific in their searches so as you get better quality results.
Come Inside
A follow on result of the way people use search engines with multi-word searches is that the results are more specific too. You may think the home page of your website is the most important, but analysis of the data reveals that over 3/4 of traffic goes to inner pages, not the home page.
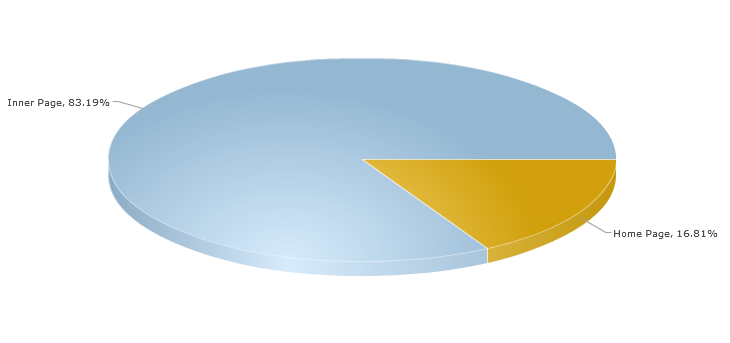
It’s worth remembering that not all traffic to a website comes from search engines, as our first chart showed. Over a quarter will likely come from elsewhere. Consider whether people linking to your site will link to your home page, or is it a particular page on your site that caught their interest?
Web Design Considerations
We’ll now look at some data regarding users themselves. People use many different types of device to browse the web. There are laptops, desktops, tables and smartphones. We’ll just look at non-mobile use here, and as the chart shows there are many many screen sizes in use today.
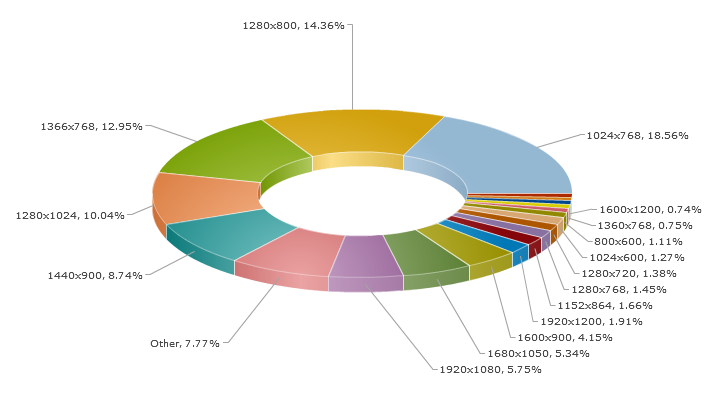
Screen sizes on desktops and laptops have grown over the last 10 years, and a minimum of 1024 pixels width should be considered for web design. This information is critical for web designers to ensure that their layouts comply with the vast majority of the intended audience.
Web designers are now concentrating on Responsive design. Rather than designing different versions of websites for different screen sizes, the idea is to make the site gracefully adapt to different device capabilities. For example this could mean showing less information on mobile devices so as not to overwhelm the user.
Backwards Compatibility
Many people only have one browser on their computer, but even those who’ve installed some alternatives will probably end up using one as their primary tool for web browsing. Browsers don’t all follow the same rules for displaying pages and checking your website across a good range of software is essential. It’s something web designers should take care of, but if you update your website yourself, occasional use of a site like Browsershots that shows you what your site looks like is a good idea.
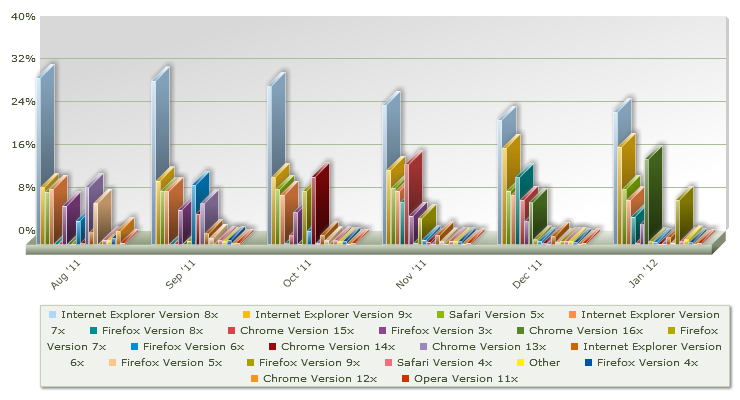
Internet Explorer still has the highest share of the market, across several different versions. It’s worth noting that Internet Explorer version 6 was notorious for displaying websites in unintended ways but has thankfully only 1.30% market share.
Summary
There is a lot to consider when building and promoting a website. We’ve looked at some data on website traffic, and this can help guide yo in building a compelling website that comes top of the search engines. However you may find some of the points we mention are not easily within your control. In general terms, search engines seek our unique, informative content wherever it may be found so if you avoid mediocrity and keep updating your website with fresh content you are on the right path to success.
Acknowledgements
This post would not have been possible without the data provided by StatOwl. Visit their site for lots more free data to help you improve your site. It is important for anybody using, referencing or relying on the data to understand the scope of coverage, which includes:
- 80% of web sites serve a predominantly United States market
- 32% of web sites classified as e-commerce sites
- 29% of web sites classified as corporate sites
- 20% of web sites classified as content delivery (blogs, news sites, etc.)
- 19% of web sites classified as “other”
Please keep the information above in mind while viewing StatOwl reports.